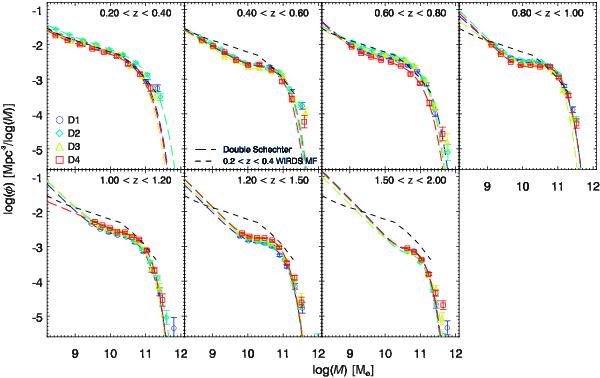
Fig. 19

The mass function is shown as a function of redshift in each of the four WIRDS fields (blue circles, green diamonds, yellow triangles and red squares for the D1, D2, D3 and D4 fields respectively). Measurements in each field were performed using different mass bins in order to be presented clearly in the plotting (i.e. there is no artificial offset between the plotted mass functions). Errors on the points are a combination of the Poissonian errors with the uncertainties from the photometric redshift estimates. The double Schechter fits to the data are shown by the long-dashed curves, whilst the short-dashed line that shows the 0.2 < z < 0.4 WIRDS mass function replicated in each panel for comparison.
Current usage metrics show cumulative count of Article Views (full-text article views including HTML views, PDF and ePub downloads, according to the available data) and Abstracts Views on Vision4Press platform.
Data correspond to usage on the plateform after 2015. The current usage metrics is available 48-96 hours after online publication and is updated daily on week days.
Initial download of the metrics may take a while.


