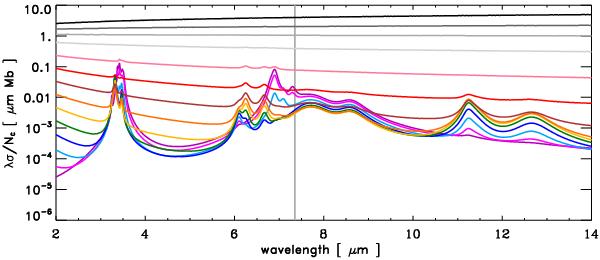
Fig. 8

The predicted spectra of optEC(s)(a)-modelled particles of radius 100 nm, presented as the wavelength times absorption coefficient per carbon atom, λα/NC, in the 2 − 14 μm region (1 Mb = 10-18 cm2). Note how the spectra evolve from aliphatic-rich with prominent IR bands to aromatic-rich with no evident IR bands but a much stronger continuum. N.B. The bands with central positions long-ward of the vertical grey line (λ(ν0) > 7.3 μm) are not yet well-determined by laboratory measurements.
Current usage metrics show cumulative count of Article Views (full-text article views including HTML views, PDF and ePub downloads, according to the available data) and Abstracts Views on Vision4Press platform.
Data correspond to usage on the plateform after 2015. The current usage metrics is available 48-96 hours after online publication and is updated daily on week days.
Initial download of the metrics may take a while.


