Fig. D.2
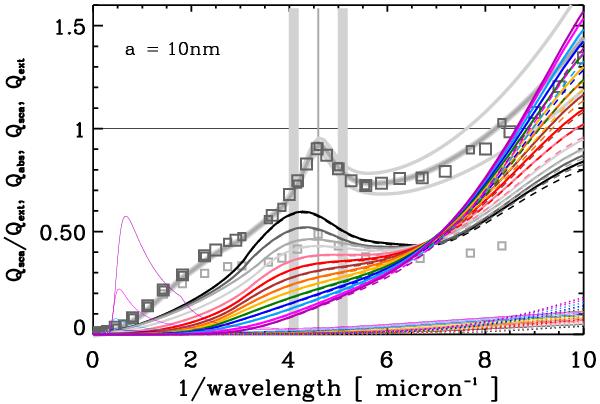
Same as for Fig. D.1 but for 10 nm radius particles. The grey squares show the diffuse ISM extinction curve for RV = 3.1 (dark) and 5.1 (light) from Savage & Mathis (1979, large squares) and Mathis (1990, small squares). The grey curves indicate the average galactic extinction, and its variation (upper and lower grey curves), as derived by Fitzpatrick & Massa (2007).
Current usage metrics show cumulative count of Article Views (full-text article views including HTML views, PDF and ePub downloads, according to the available data) and Abstracts Views on Vision4Press platform.
Data correspond to usage on the plateform after 2015. The current usage metrics is available 48-96 hours after online publication and is updated daily on week days.
Initial download of the metrics may take a while.