Fig. 14
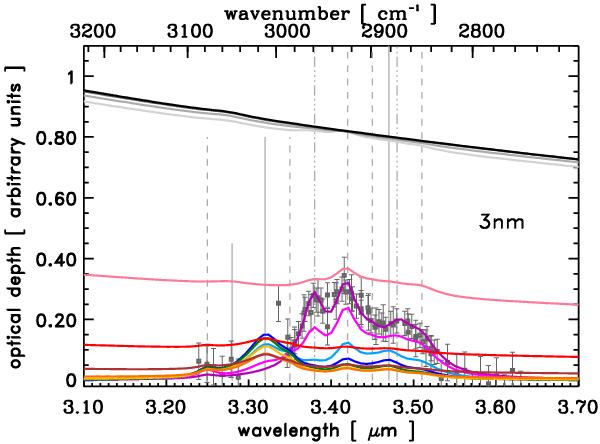
The 3 μm region spectrum, presented as optical depth, for a = 3 nm a-C(:H) particles for increasing band gap, Eg = −0.1 to 0.25 eV (upper, grey-black), Eg = 0.5 eV (middle, pink), Eg = 0.75 eV (lower, red, y-axis intercept at ≈ 0.12) and Eg = 1 to 2.67 eV (lower, yellow-purple, bottom to top at ≈ 3.45 μm). The thin, grey, vertical lines indicate the band origins (see Paper I): aromatic (short), olefinic (medium) and aliphatic (long), CH (solid), CH2 (dashed) and CH3 (dashed-triple dotted). The data with error bars (in grey) are for the diffuse ISM line of sight towards the Galactic Centre source IRS6E and Cyg OB2 No. 12 (taken from Pendleton & Allamandola 2002). For comparison the observational data are scaled to the Eg = 2.67 eV data.
Current usage metrics show cumulative count of Article Views (full-text article views including HTML views, PDF and ePub downloads, according to the available data) and Abstracts Views on Vision4Press platform.
Data correspond to usage on the plateform after 2015. The current usage metrics is available 48-96 hours after online publication and is updated daily on week days.
Initial download of the metrics may take a while.