Fig. 1
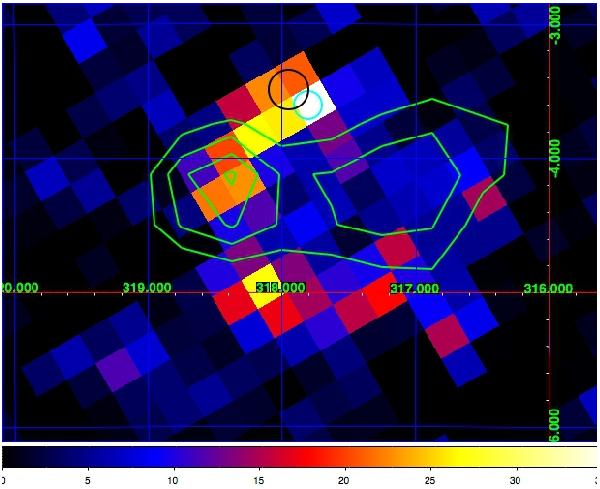
Test statistics map for photon energies 10 ≤ E ≤ 300 GeV. The cyan circle denotes the error circle of the best fit position of the LAT source in this energy band and the black circle indicates the intrinsic width of the H.E.S.S. source. Overlaid in green are CO contours (Dame et al. 2001) of the foreground molecular cloud located at a distance of ≈ 400 pc (− 10 to 0 km s-1) and measured in units of average temperature (from 0.75 to 1.5 K in steps of 0.25 K).
Current usage metrics show cumulative count of Article Views (full-text article views including HTML views, PDF and ePub downloads, according to the available data) and Abstracts Views on Vision4Press platform.
Data correspond to usage on the plateform after 2015. The current usage metrics is available 48-96 hours after online publication and is updated daily on week days.
Initial download of the metrics may take a while.