Fig. 4
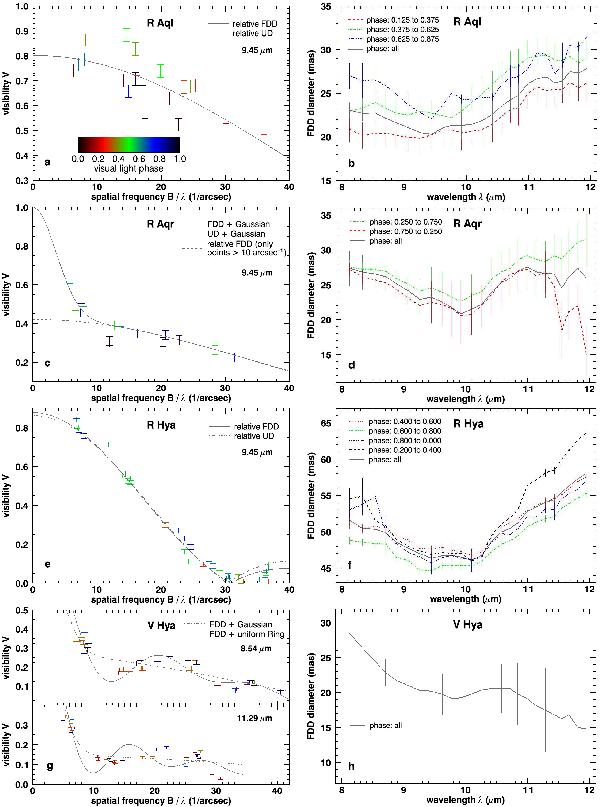
Left: fits of different models to the visibility measurements at a representative wavelength. The visibility data are plotted versus spatial frequency and are color-coded by visual light phase. Right: the fitted circular fully limb-darkened disk diameter, θFDD, as function of wavelength for the full data set and selected pulsation phases. The corresponding plots for W Hya can be found in Paper I (Figs. 6 and 8, respectively).
Current usage metrics show cumulative count of Article Views (full-text article views including HTML views, PDF and ePub downloads, according to the available data) and Abstracts Views on Vision4Press platform.
Data correspond to usage on the plateform after 2015. The current usage metrics is available 48-96 hours after online publication and is updated daily on week days.
Initial download of the metrics may take a while.