Fig. 2
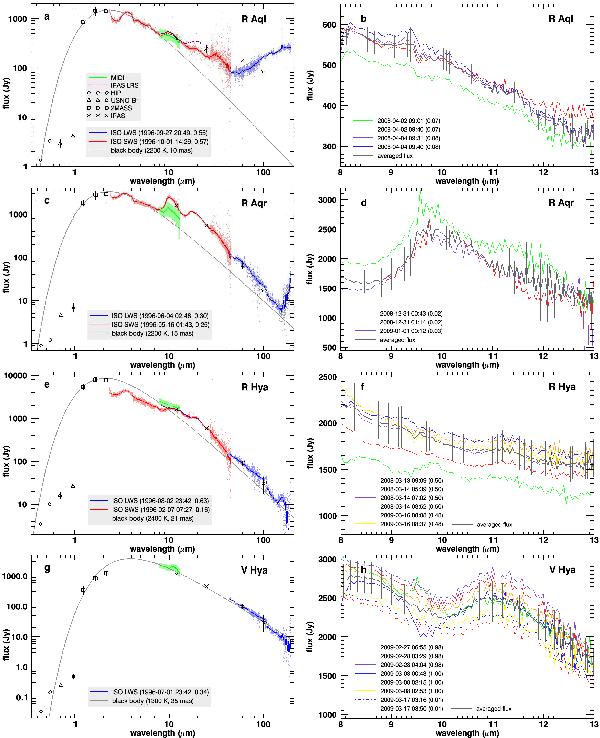
Left: spectral energy distribution for all stars (see text). The black body curve is only included for guidance. Right: all available individual MIDI spectra around the visual maxima for all stars (including an average of these) except for R Hya were the spectra around the visual minima are given. The visual light phases are given in brackets. Note that due to the telluric ozone feature the uncertainties at around 9.6 μm are increased. The corresponding plots for W Hya can be found in Paper I (Fig. 5).
Current usage metrics show cumulative count of Article Views (full-text article views including HTML views, PDF and ePub downloads, according to the available data) and Abstracts Views on Vision4Press platform.
Data correspond to usage on the plateform after 2015. The current usage metrics is available 48-96 hours after online publication and is updated daily on week days.
Initial download of the metrics may take a while.