Fig. 1
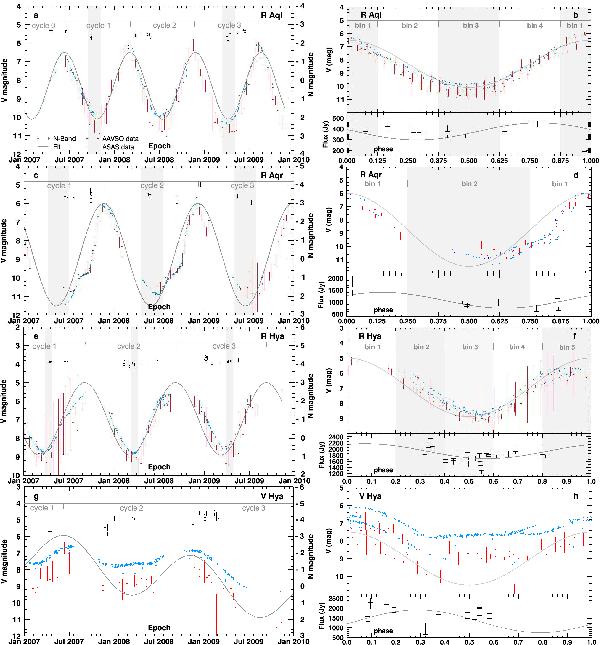
Left: visual light curves covering the period of the MIDI observations. Simple sinusoidal fits are included to determine the pulsation phases used throughout this paper. The MIDI fluxes at around 12 μm are shown as well with the magnitude scale given on the right. Right: same as left, but plotted versus visual phase. The MIDI fluxes at around 12 μm are shown in the lower panels of each plot. The data within the shaded regions in both columns are used for size and flux variation studies in Sect. 5.3. The corresponding plots for W Hya can be found in Paper I (Figs. 3 and 4, respectively).
Current usage metrics show cumulative count of Article Views (full-text article views including HTML views, PDF and ePub downloads, according to the available data) and Abstracts Views on Vision4Press platform.
Data correspond to usage on the plateform after 2015. The current usage metrics is available 48-96 hours after online publication and is updated daily on week days.
Initial download of the metrics may take a while.