Free Access
Fig. 15
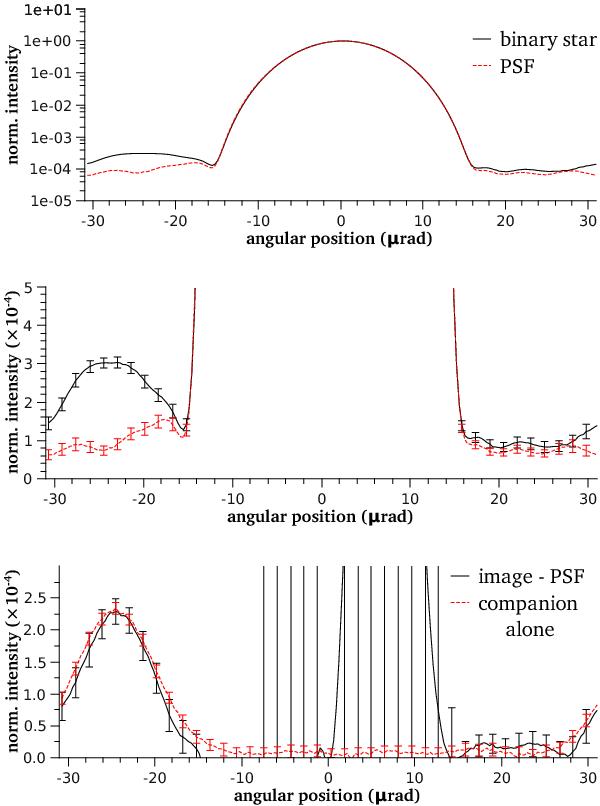
Top: comparison between long exposure (2 min) PSF and image of a binary system in logarithmic scale. Middle: same as top in linear scale. Bottom: comparison between an image of the faint companion alone and the difference between the binary system image and the PSF. Note that error bars are given at 3σ.
Current usage metrics show cumulative count of Article Views (full-text article views including HTML views, PDF and ePub downloads, according to the available data) and Abstracts Views on Vision4Press platform.
Data correspond to usage on the plateform after 2015. The current usage metrics is available 48-96 hours after online publication and is updated daily on week days.
Initial download of the metrics may take a while.