Free Access
Fig. 13
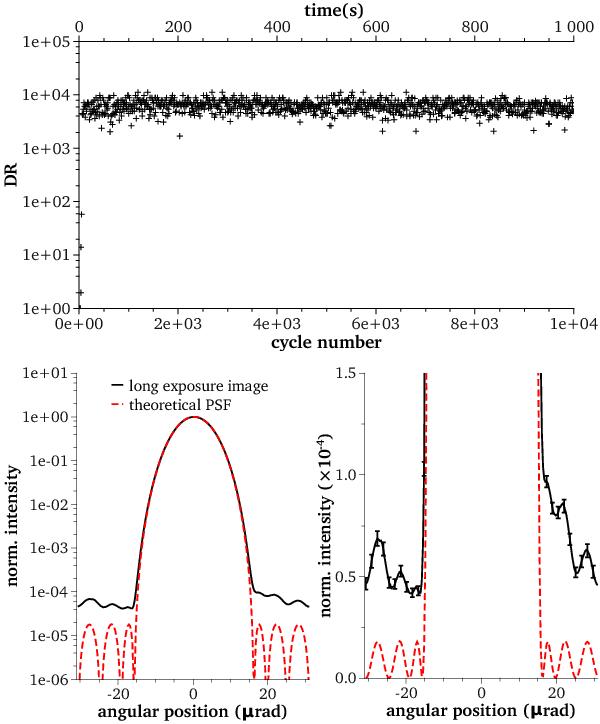
Top: experimental PSF DR evolution with time for short exposure images. Bottom: comparison between ideal PSF and long-exposure images (1000 s) obtained by adding 104 short-exposure images on logarithmic (left) and linear (right) scale. Note that error bars are given at 3σ.
This figure is made of several images, please see below:
Current usage metrics show cumulative count of Article Views (full-text article views including HTML views, PDF and ePub downloads, according to the available data) and Abstracts Views on Vision4Press platform.
Data correspond to usage on the plateform after 2015. The current usage metrics is available 48-96 hours after online publication and is updated daily on week days.
Initial download of the metrics may take a while.