Fig. 18
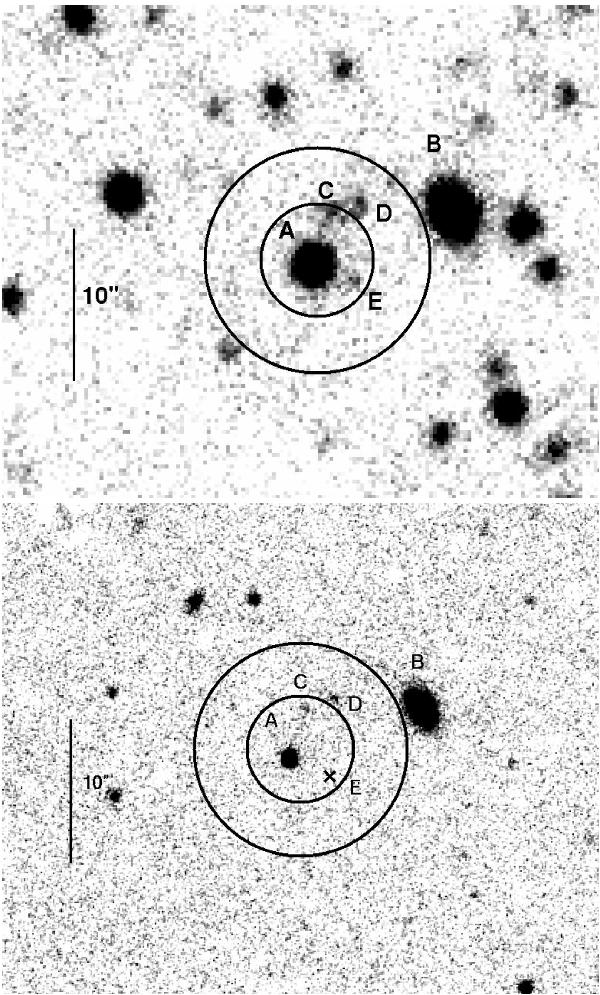
Deep VLT/FORS1 RC-band (top) and HAWKI Ks-band image (bottom) of the XRT error circle of GRB 080915A taken 28 h after the burst. Also shown is the 90% c.l. XRT error circle ( ), as well as a circle of radius 2r0. In the Ks-band image, object E is not visible and, therefore, is indicated by a cross. Note that all objects visible in the ISAAC image have a counterpart in the FORS1 image taken 11 days later.
Current usage metrics show cumulative count of Article Views (full-text article views including HTML views, PDF and ePub downloads, according to the available data) and Abstracts Views on Vision4Press platform.
Data correspond to usage on the plateform after 2015. The current usage metrics is available 48-96 hours after online publication and is updated daily on week days.
Initial download of the metrics may take a while.