Free Access
Fig. 6
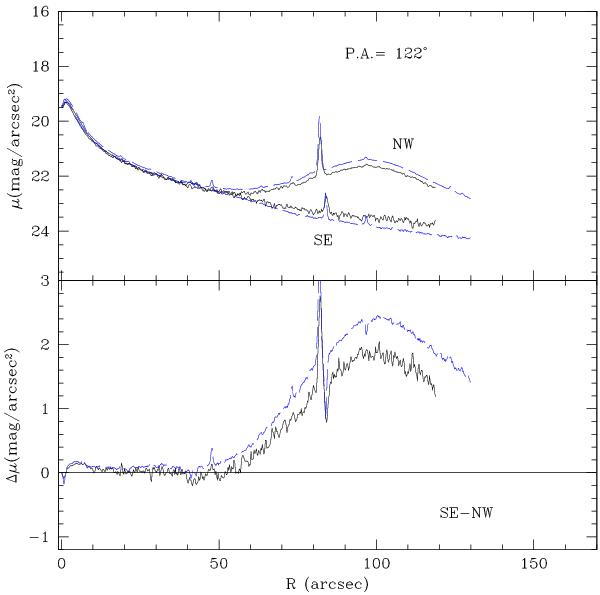
Same as Fig. 5. Upper panel: folded V-band profiles extracted along PA = 122° (minor axis, 2.2 m/WFI black full lines, VLT/FORS1 blue dashed lines). South-east is along PA = 122°, NW along PA = 302°. Lower panel: difference profiles. On the NW side, for R ≥ 65′′ we see the contribution of the outer regions of NGC 3309.
Current usage metrics show cumulative count of Article Views (full-text article views including HTML views, PDF and ePub downloads, according to the available data) and Abstracts Views on Vision4Press platform.
Data correspond to usage on the plateform after 2015. The current usage metrics is available 48-96 hours after online publication and is updated daily on week days.
Initial download of the metrics may take a while.