Fig. 17
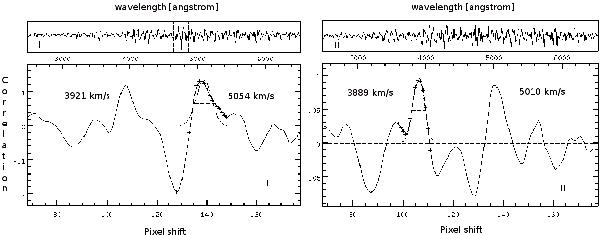
Cross-correlation functions used for kinematic measurements in two slit sections. Upper panels: Fourier cross-correlation functions computed between the residual (excess) spectra and the spectrum of the G dwarf star HD 102070 for spectrum I (left) and II (right). Lower panels: enlarged view of the Fourier cross-correlation function peaks. The double peaks in both Fourier cross-correlation functions indicate the presence of two sets of absorption-line features at different velocities in the residual spectra. The more red-shifted peaks in the Fourier cross-correlation are at velocities VLOS,1 = 5054, 5010 ( ± 55) km s-1, and the secondary bluer peaks are at VLOS,2 = 3921, 3889 ( ± 55) km s-1.
Current usage metrics show cumulative count of Article Views (full-text article views including HTML views, PDF and ePub downloads, according to the available data) and Abstracts Views on Vision4Press platform.
Data correspond to usage on the plateform after 2015. The current usage metrics is available 48-96 hours after online publication and is updated daily on week days.
Initial download of the metrics may take a while.