Fig. 10
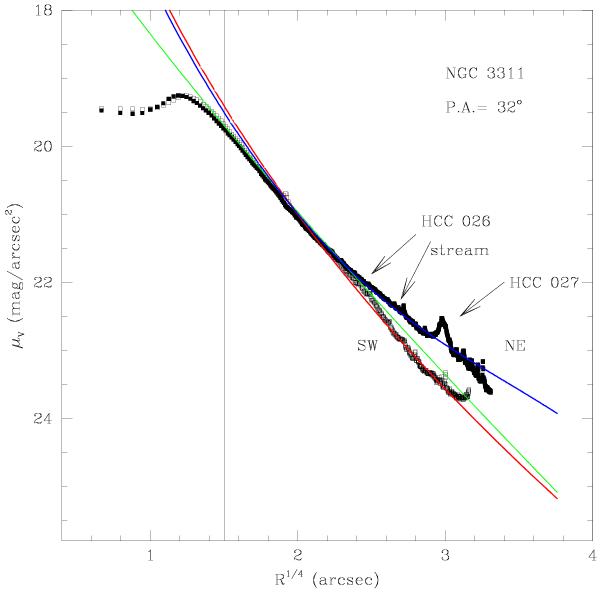
Folded 1D surface brightness profile along the major axis of NGC 3311 plotted as function of R1/4. Open symbols show values along PA = 212° (SW), full symbols those along PA = 32° (NE of the galaxy center). The green continuous line shows the extracted 1D major-axis profile of the Sersic “allmask” model for the V-band FORS1 data described in Sect. 4.1. The red continuum line is the major axis profile for the light centered on NGC 3311 (“maximal” symmetric model, MSM). The blue full line shows the 1D fit to the surface brightness profile along PA = 32° (NE) with a two-component model, consisting of the MSM plus a one-sided exponential profile. The arrows indicate the position of the stream around HCC 026 and the light at R ≃ 80′′ associated with the dwarf galaxy HCC 027, which falls on the extracted profile. See Sect. 4.2 for details.
Current usage metrics show cumulative count of Article Views (full-text article views including HTML views, PDF and ePub downloads, according to the available data) and Abstracts Views on Vision4Press platform.
Data correspond to usage on the plateform after 2015. The current usage metrics is available 48-96 hours after online publication and is updated daily on week days.
Initial download of the metrics may take a while.