Fig. 9
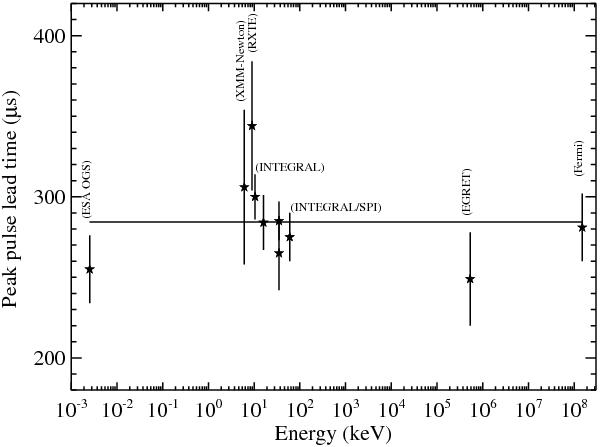
Peak pulse lead time (μs) of various observations plotted against energy (keV) in optical, X-rays and γ-ray energy bands. A constant model is fitted to the data, which is found to be 284.4 μs. The data points shown above cover more than seven orders of magnitude in energy and come from different observations and experiments mentioned in the graph (Kuiper et al. 2003; Rots et al. 2004; Oosterbroek et al. 2008; Abdo et al. 2010; Molkov et al. 2010). Only the central energy corresponding to an individual observation was plotted along with the corresponding lead time measured within the observed energy band.
Current usage metrics show cumulative count of Article Views (full-text article views including HTML views, PDF and ePub downloads, according to the available data) and Abstracts Views on Vision4Press platform.
Data correspond to usage on the plateform after 2015. The current usage metrics is available 48-96 hours after online publication and is updated daily on week days.
Initial download of the metrics may take a while.