Fig. 8
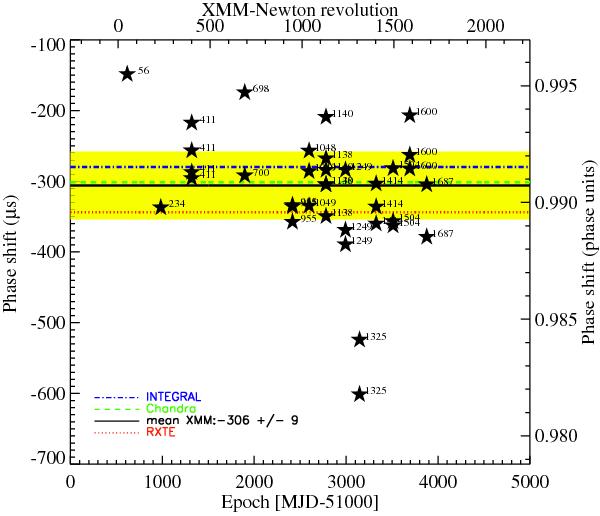
Absolute timing as a function of MJD using Crab-pulsar monitoring data. Shown are the offsets of the main X-ray peak with respect to the main radio peak in the Crab pulse profile in time units (left scale) and phase units (right scale). The coloured lines give the mean values for XMM-Newton (solid black line, this work), Chandra (green dashed line), RXTE (red dot line) and INTEGRAL (blue dashed-dot line), respectively, all taken from the literature. The yellow area indicates the standard deviation of the XMM-Newton data points. The superscript numbers near to each XMM-Newton data point give the XMM-Newton revolution in which the observation was carried out.
Current usage metrics show cumulative count of Article Views (full-text article views including HTML views, PDF and ePub downloads, according to the available data) and Abstracts Views on Vision4Press platform.
Data correspond to usage on the plateform after 2015. The current usage metrics is available 48-96 hours after online publication and is updated daily on week days.
Initial download of the metrics may take a while.