Free Access
Fig. 7
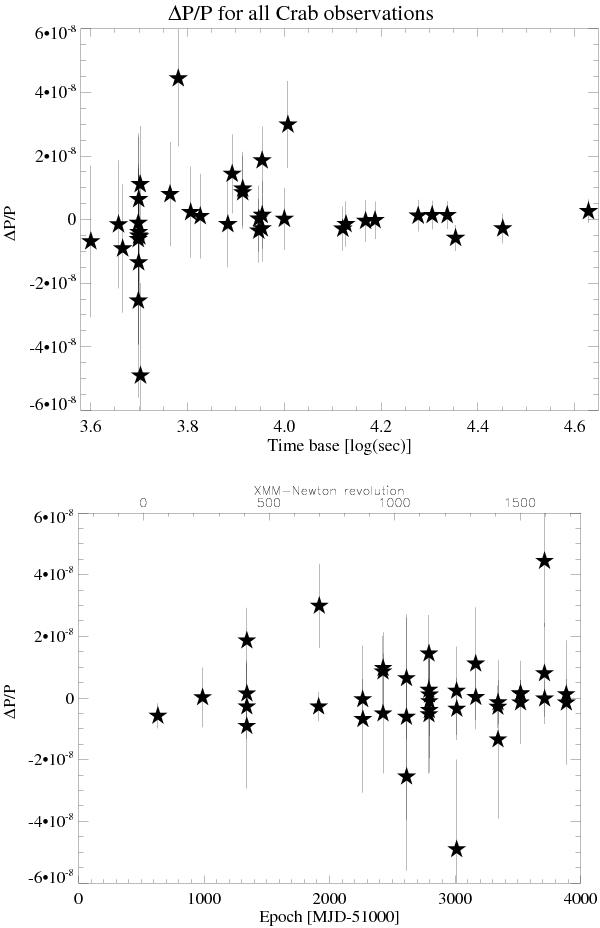
Relative timing using Crab monitoring data: upper panel as a function of observing time, lower panel as a function of MJD. These plots are regularly updated in the EPIC Calibration Status Document (Guainazzi et al. 2011) using the routine calibration observations of the Crab.
This figure is made of several images, please see below:
Current usage metrics show cumulative count of Article Views (full-text article views including HTML views, PDF and ePub downloads, according to the available data) and Abstracts Views on Vision4Press platform.
Data correspond to usage on the plateform after 2015. The current usage metrics is available 48-96 hours after online publication and is updated daily on week days.
Initial download of the metrics may take a while.