Fig. 4
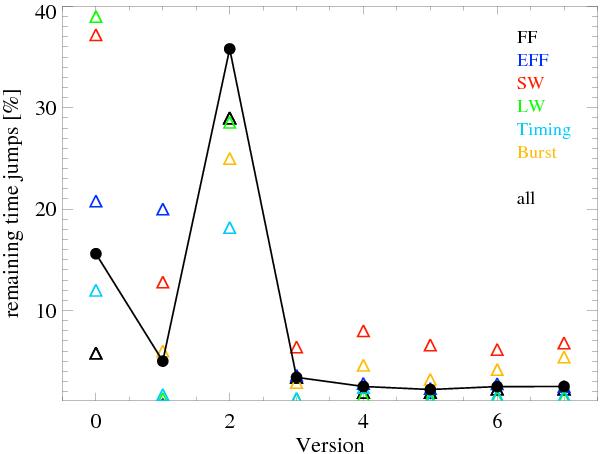
Remaining time jumps in the EPIC-pn data after all SAS correction algorithms. The triangles correspond to the remaining time jumps (in percent) for each Epic-pn mode: FF (black), eFF (blue), SW (red), LW green), timing (light blue) and burst yellow). Filled circles represent the overall remaining time jumps for all XMM-Newton observations up to revolution 1061. The numbers stand for the different processing versions of the algorithm. Versions: 0: old frame times (oft) and old algorithm, 1: new frame times (nft) and old algorithm, 2: nft and SAS_JUMP_TOLERANCE (SJT) 19.0, 3: nft and SJT 20.0, 4: nft and SJT 21.0, 5: nft and SJT 22.0, 6: nft and SJT 23.0 and 7: nft and SJT 24.0.
Current usage metrics show cumulative count of Article Views (full-text article views including HTML views, PDF and ePub downloads, according to the available data) and Abstracts Views on Vision4Press platform.
Data correspond to usage on the plateform after 2015. The current usage metrics is available 48-96 hours after online publication and is updated daily on week days.
Initial download of the metrics may take a while.