Fig. 3
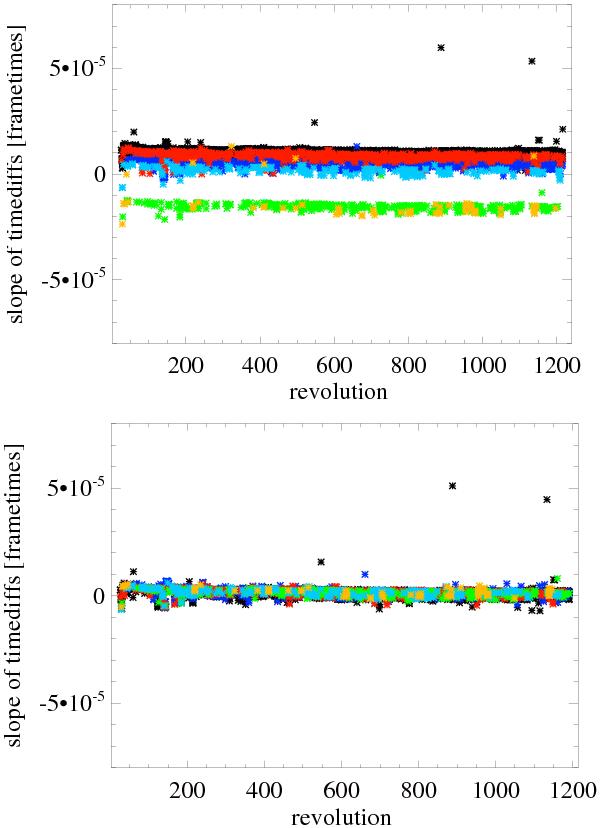
Time difference between consecutive events determined using the slope of a linear fit to the time differences of consecutive events modulo the frame time. This is plotted against time. Upper panel with old frame times, lower panel with the refined ones. The different modes of EPIC-pn are represented by different colours: full frame (black, extended full frame (dark blue), large window (green), small window (red), timing (light blue), burst (yellow).
Current usage metrics show cumulative count of Article Views (full-text article views including HTML views, PDF and ePub downloads, according to the available data) and Abstracts Views on Vision4Press platform.
Data correspond to usage on the plateform after 2015. The current usage metrics is available 48-96 hours after online publication and is updated daily on week days.
Initial download of the metrics may take a while.