Fig. 2
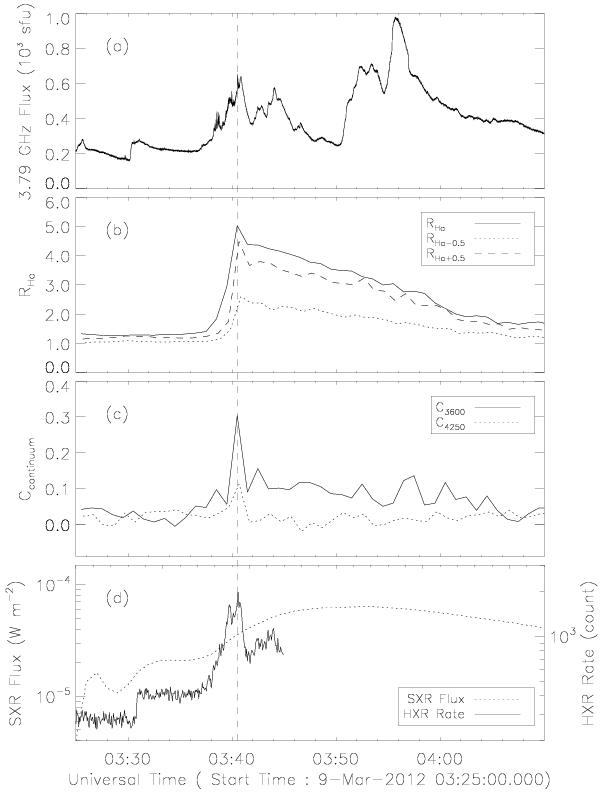
Time profiles of the radio flux at 3.79 GHz, the intensity enhancement R = I/I0 at the Hα line center and 6562.8 ± 0.5 Å, the continuum contrast C = (I − I0)/I at 4250 Å and 3600 Å, the RHESSI hard X-ray (50–100 keV) flux, and the GOES soft X-ray (1–8 Å) flux of the WLF. The light curves in the white-light and Hα bands are computed in the WLF kernel as shown in Fig. 1, and those in other bands are computed for the entire solar disk. The HXR data after 03:45 UT are omitted owing to a change of the various attenuators.
Current usage metrics show cumulative count of Article Views (full-text article views including HTML views, PDF and ePub downloads, according to the available data) and Abstracts Views on Vision4Press platform.
Data correspond to usage on the plateform after 2015. The current usage metrics is available 48-96 hours after online publication and is updated daily on week days.
Initial download of the metrics may take a while.