Fig. 1
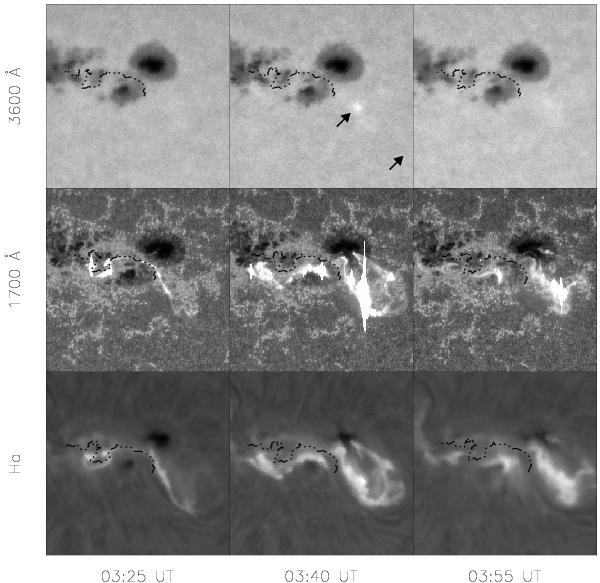
Images showing the M6.3 flare evolution at 3600 Å, 1700 Å, and the Hα line center before the WLF (left column), at the peak time of the WLF (middle column), and after the WLF (right column) on 2012 March 9. The field of view of each image is 200′′ × 200′′. The location of the center of the field of view is around (30′′,380′′). The upper-left arrow indicates the area where the white-light and Hα intensities are measured as shown in Fig. 2. The lower-right arrow indicates the quiet region selected as the background. Dash-dotted lines mark the polarity inversion line of the line-of-sight magnetogram.
Current usage metrics show cumulative count of Article Views (full-text article views including HTML views, PDF and ePub downloads, according to the available data) and Abstracts Views on Vision4Press platform.
Data correspond to usage on the plateform after 2015. The current usage metrics is available 48-96 hours after online publication and is updated daily on week days.
Initial download of the metrics may take a while.