Fig. 2
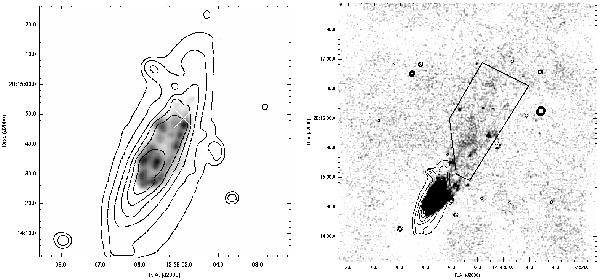
Left panel: grayscale representation of the inner structure of the NET image of NGC 4848 at full resolution, with contours of the OFF-band image. The white cross marks the center of the molecular hydrogen given by Vollmer et al. (2001), while the white X marks the center of the HI given by Bravo Alfaro et al. (2001). Right panel: high-contrast representation of the Gaussian-smoothed (three-pixel-kernel) NET image to highlight the emission in the tail, with contours of the OFF-band image. The black box marks the region where the flux in the tail was computed.
Current usage metrics show cumulative count of Article Views (full-text article views including HTML views, PDF and ePub downloads, according to the available data) and Abstracts Views on Vision4Press platform.
Data correspond to usage on the plateform after 2015. The current usage metrics is available 48-96 hours after online publication and is updated daily on week days.
Initial download of the metrics may take a while.