Fig. 1
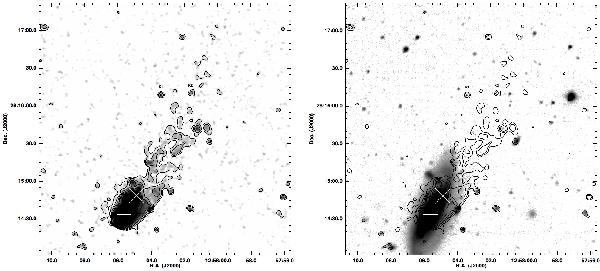
Left panel: grayscale representation of the Gaussian-smoothed (three-pixel-kernel) NET image of NGC 4848, with contours of the same image (contours are from 1 to 320 × 10-17 erg cm-2 s-1 arcsec-2 in 10 logarithmic intervals). The white cross marks the center of the molecular hydrogen given by Vollmer et al. (2001), while the white X marks the center of the HI given by Bravo Alfaro et al. (2001). Three knots of NET emission with associated stellar continuum are marked K1-3. Right panel: grayscale representation of the OFF image of NGC 4848, with contours of the Gaussian-smoothed (three-pixel-kernel) NET image (same as left panel). Note the angle between the major axis of the galaxy and the direction marked by the tail, which points toward the center of the Coma cluster.

Current usage metrics show cumulative count of Article Views (full-text article views including HTML views, PDF and ePub downloads, according to the available data) and Abstracts Views on Vision4Press platform.
Data correspond to usage on the plateform after 2015. The current usage metrics is available 48-96 hours after online publication and is updated daily on week days.
Initial download of the metrics may take a while.