Free Access
Fig. 2
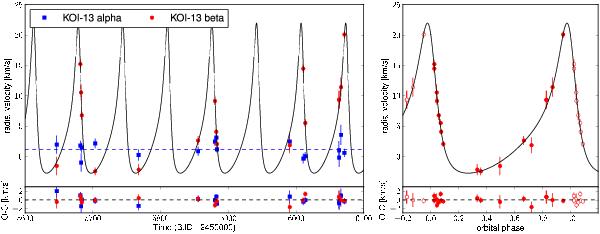
Radial velocity curves and residuals of KOI-13α (blue squares) and KOI-β (red circles) measured by SOPHIE against time (left panels) and phase-folded to the best-fit period of KOI-13β (right panels). The dashed blue line represents the systemic RV of KOI-13α.
Current usage metrics show cumulative count of Article Views (full-text article views including HTML views, PDF and ePub downloads, according to the available data) and Abstracts Views on Vision4Press platform.
Data correspond to usage on the plateform after 2015. The current usage metrics is available 48-96 hours after online publication and is updated daily on week days.
Initial download of the metrics may take a while.