Fig. 3
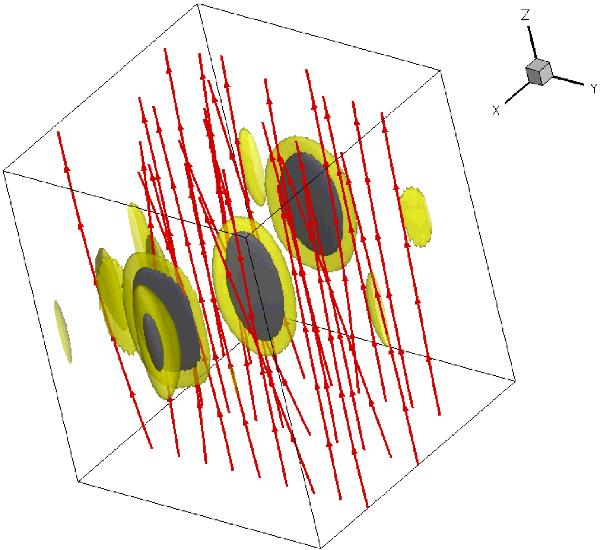
Temperature is organized in quasi-2D pancake-like structures aligned with the magnetic field. The two isosurfaces for T = 106 K and T = 1.2 × 10⁶ K at time t = 300 are shown in yellow and gray (corresponding to T = 100,120 in nondimensional units), respectively. Sample magnetic field-lines are drawn in red. The box has been rescaled in z to clarify the visualization.
Current usage metrics show cumulative count of Article Views (full-text article views including HTML views, PDF and ePub downloads, according to the available data) and Abstracts Views on Vision4Press platform.
Data correspond to usage on the plateform after 2015. The current usage metrics is available 48-96 hours after online publication and is updated daily on week days.
Initial download of the metrics may take a while.