Fig. 9
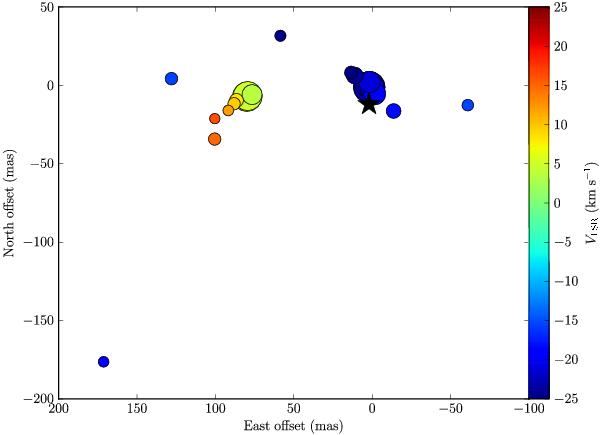
H2O maser emissions distribution toward NML Cyg from VLA observation on 2008 December 20. All offsets are relative to the strongest maser emission at VLSR of −22.25 km s-1. All the maser spots are marked with circles, with sizes proportional to the logarithm of their flux densities. The position of the central star is indicated by a star. (This figure is available in color in electronic form.)
Current usage metrics show cumulative count of Article Views (full-text article views including HTML views, PDF and ePub downloads, according to the available data) and Abstracts Views on Vision4Press platform.
Data correspond to usage on the plateform after 2015. The current usage metrics is available 48-96 hours after online publication and is updated daily on week days.
Initial download of the metrics may take a while.