Fig. 8
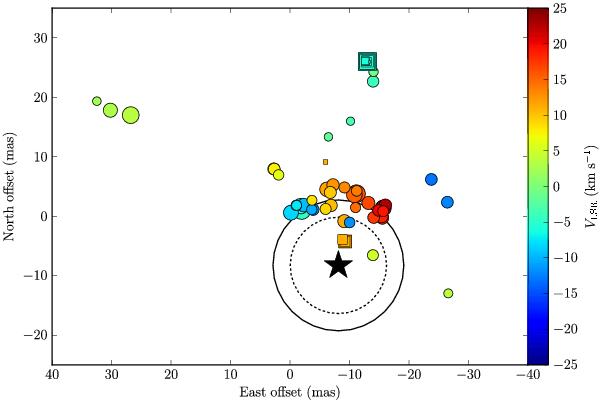
Comparison of SiO maser distribution from the VLBA observation (squares) on 2009 May 25 and VLA observation (circles) on 2008 December 20, after cross-registration (see the text). The sizes of the markers are proportional to the logarithm of their flux densities. The VLSR of the maser spots is color-coded as indicated by the color bar on the right side. The position of the central star is indicated as the star. The solid circle and dotted circle denote the stellar diameter of 22 mas from this paper and 16 mas from Blöcker et al. (2001), respectively. (This figure is available in color in electronic form.)
Current usage metrics show cumulative count of Article Views (full-text article views including HTML views, PDF and ePub downloads, according to the available data) and Abstracts Views on Vision4Press platform.
Data correspond to usage on the plateform after 2015. The current usage metrics is available 48-96 hours after online publication and is updated daily on week days.
Initial download of the metrics may take a while.