Fig. 7
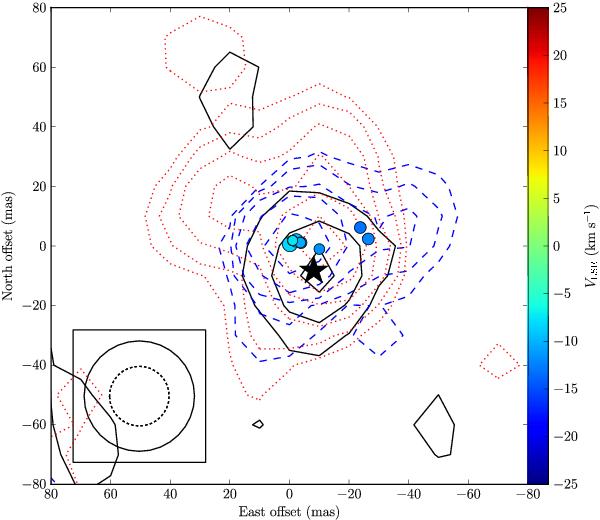
SiO maser emissions integrated over VLSR from −28.86 to −7.14 km s-1 (dashed contour) which is within the same VLSR range as that of the narrow-band data, and VLSR from −7.14 to 22.93 km s-1 (dotted contour) toward NML Cyg superposed on the 43 GHz continuum emission (solid contour) with peak position indicated by the star. The maser spots within the same VLSR range as the narrow-band data are marked with circles, with size proportional to the logarithm of their flux densities. The VLSR of the maser spots is color-coded as indicated by the color bar on the right side, which use the same range of VLSR as other maser spots figures in this paper for comparison. All offsets are relative to the strongest maser emission at VLSR of −4.66 km s-1. The relative positions of the SiO maser and radio continuum emission is estimated to be accurate to ≈3 mas. Contour levels for integrated maser emission are 0.18 Jy beam-1 × 2n,n = 0...5 and for the radio continuum are integer multiples of 0.10 mJy beam-1. The restoring beam for the maser (dotted circle) and continuum (solid circle) emissions are indicated in the lower left corner. (This figure is available in color in electronic form.)
Current usage metrics show cumulative count of Article Views (full-text article views including HTML views, PDF and ePub downloads, according to the available data) and Abstracts Views on Vision4Press platform.
Data correspond to usage on the plateform after 2015. The current usage metrics is available 48-96 hours after online publication and is updated daily on week days.
Initial download of the metrics may take a while.