Fig. 3
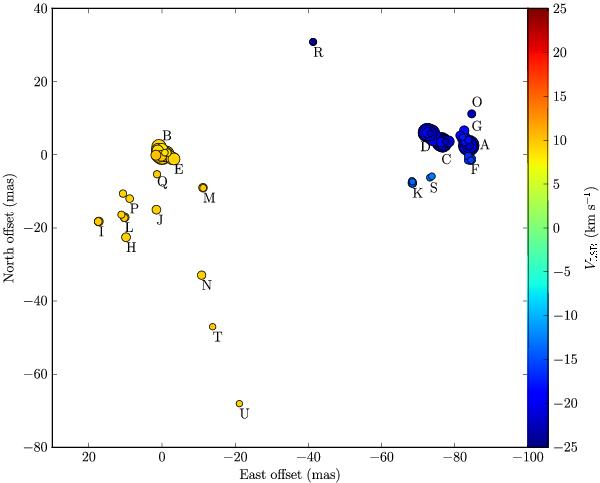
Spatial distribution of the H2O maser features toward NML Cyg from VLBA observations at five epochs. Each maser spot is represented by a letter label and a filed circle whose area is proportional to the logarithm of the flux density, using the position and flux density from the epoch at which it was first detected. The color bar denotes the VLSR range from −25 to +25 km s-1. The reference maser spot is in feature B, located at (0, 0) mas. (This figure is available in color in electronic form.)
Current usage metrics show cumulative count of Article Views (full-text article views including HTML views, PDF and ePub downloads, according to the available data) and Abstracts Views on Vision4Press platform.
Data correspond to usage on the plateform after 2015. The current usage metrics is available 48-96 hours after online publication and is updated daily on week days.
Initial download of the metrics may take a while.