Fig. 8
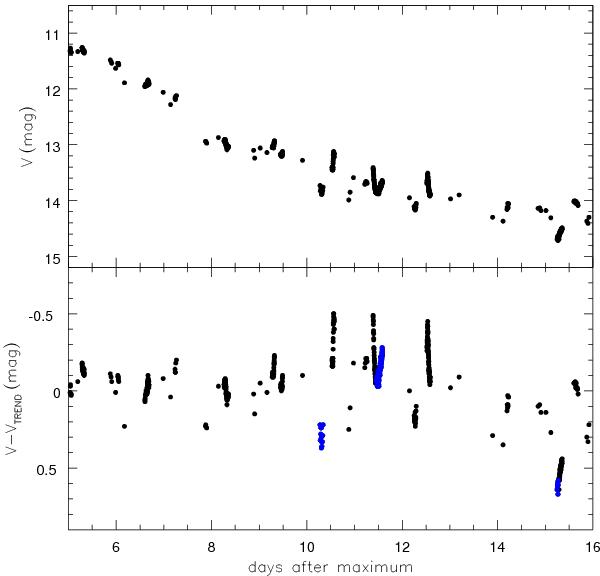
Top panel: U Sco 2010 outburst light curve from +5 to +16. Bottom panel: U Sco light curve in the same period, after subtraction of the decline trend (courtesy of Brad Schaefer). The blue points in the bottom panel marks the observations taken between orbital phase 0.9 and 1, i.e. roughly when the white dwarf eclipse is expected (see Schaefer et al. 2011, for more details).
Current usage metrics show cumulative count of Article Views (full-text article views including HTML views, PDF and ePub downloads, according to the available data) and Abstracts Views on Vision4Press platform.
Data correspond to usage on the plateform after 2015. The current usage metrics is available 48-96 hours after online publication and is updated daily on week days.
Initial download of the metrics may take a while.