Free Access
Fig. 7
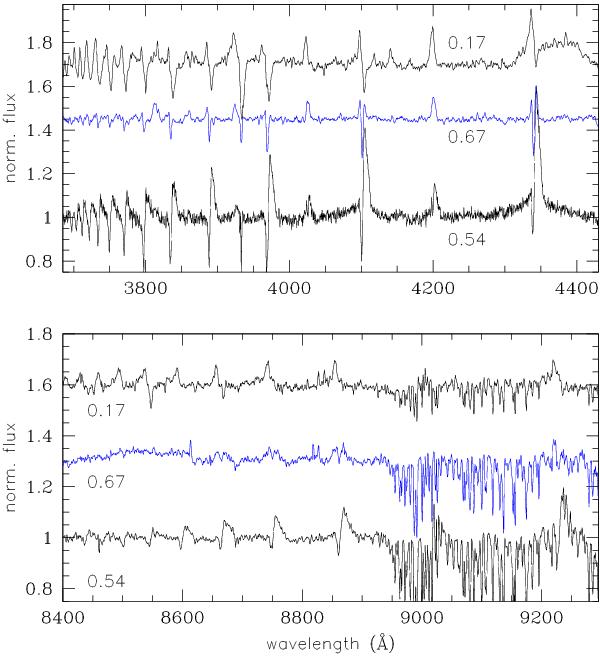
H Balmer (top) and Paschen (bottom) series and their profile variation, as visible in epochs +17, +27 and +104 days. The corresponding orbital phase is marked near each spectrum. Note that all but the bottom spectrum in the top panel have been smoothed with a box function of 5 points.
This figure is made of several images, please see below:
Current usage metrics show cumulative count of Article Views (full-text article views including HTML views, PDF and ePub downloads, according to the available data) and Abstracts Views on Vision4Press platform.
Data correspond to usage on the plateform after 2015. The current usage metrics is available 48-96 hours after online publication and is updated daily on week days.
Initial download of the metrics may take a while.