Fig. 6
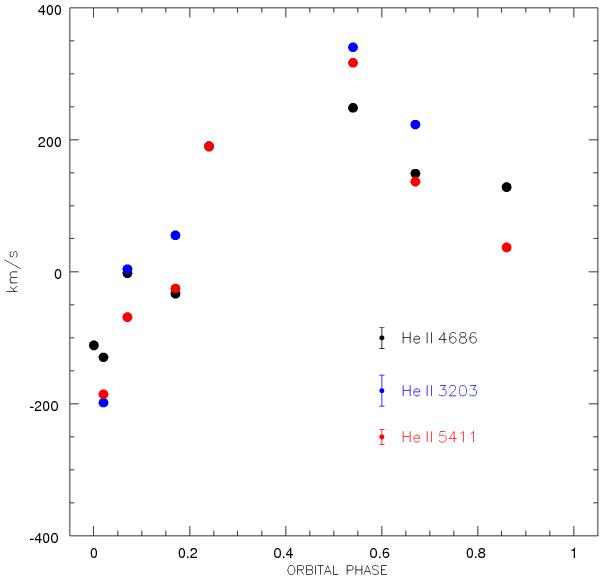
Radial velocity curve of the unblended He ii emission lines derived by measuring the emission line flux barycenter. Different colors represent different lines and the color code is in the figure, together with the uncertainty associated to each line. The error bars plot in the figure correspond to the resolution element (FWHM). Velocities have been corrected for Heliocentric velocity and the zero-wavelength offset discussed in Sect. 5.
Current usage metrics show cumulative count of Article Views (full-text article views including HTML views, PDF and ePub downloads, according to the available data) and Abstracts Views on Vision4Press platform.
Data correspond to usage on the plateform after 2015. The current usage metrics is available 48-96 hours after online publication and is updated daily on week days.
Initial download of the metrics may take a while.