Fig. 4
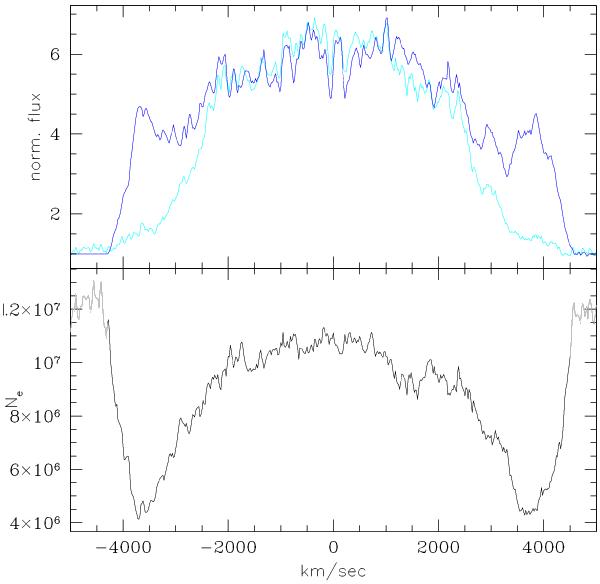
Electron density, Ne, in U Sco ejecta as derived from the [O iii] flux ratio in the April spectrum. In the top panel the blue and cyan lines represent the profile of the λ5007 and λ4363 emission lines, respectively. In the bottom panel the black line shows how the density varies across the emission/ejecta: assuming Te = 12 000 K (see Mason 2011, for details), the high velocity wings (~ ± 4000 km s-1) have a density of ~5 × 10⁶ e−/cm3; while the “low velocity” component (~ ± 3000 km s-1) has density twice as high, i.e. ~1 × 10⁷ e−/cm3. Note that the density values beyond ~4000−4500 km s-1 are spurious due to the uncertain position of the continuum. The contribution of [O iii]λ4959 has been subtracted from the λ5007 emission, assuming symmetric profiles.
Current usage metrics show cumulative count of Article Views (full-text article views including HTML views, PDF and ePub downloads, according to the available data) and Abstracts Views on Vision4Press platform.
Data correspond to usage on the plateform after 2015. The current usage metrics is available 48-96 hours after online publication and is updated daily on week days.
Initial download of the metrics may take a while.