Fig. 2
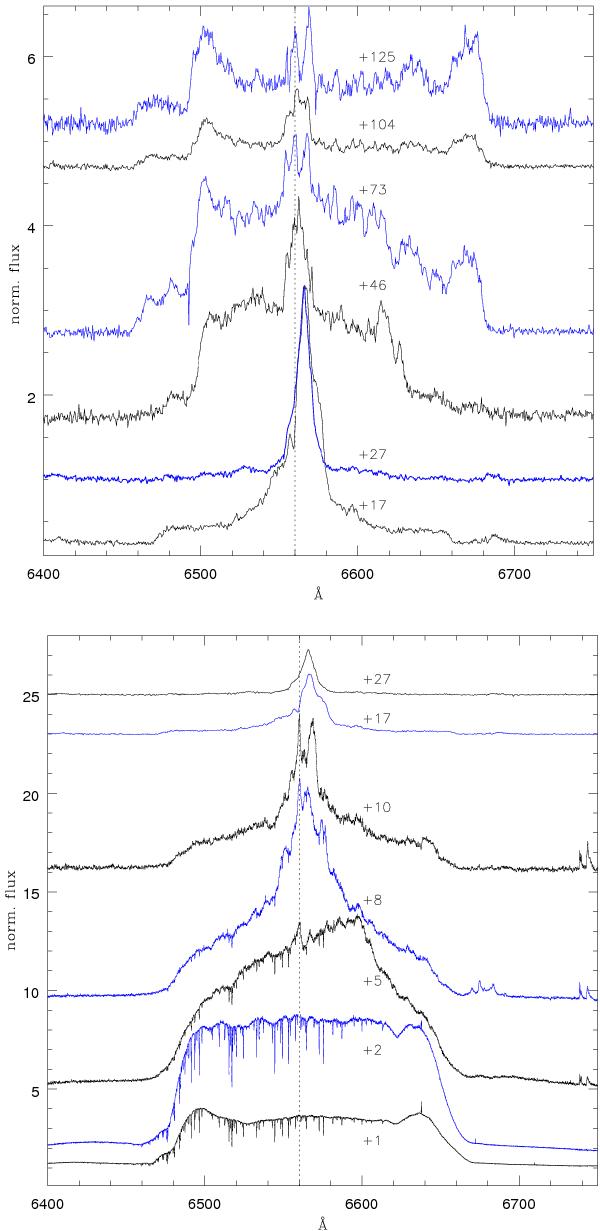
Bottom panel: montage of the Hα profile evolution during the first 7 epochs of observations. Time goes from bottom to top, and the first 5 spectra were taken with the 2.2 m+FEROS. Top panel: montage of the Hα profile evolution during the last 6 epochs which were taken with the VLT+X-Shooter. Note that epochs 6 and 7 appear in both panels. The sequence has been presented in two separate panels for clarity: the intensity of the broad component decreased by a factor ~65 from epoch 2 (at maximum light) to epoch 7 (see Fig. 3). The dotted vertical line marks the Hα rest wavelength. The numbers near each spectrum mark the epoch of the spectrum itself in days after maximum.
Current usage metrics show cumulative count of Article Views (full-text article views including HTML views, PDF and ePub downloads, according to the available data) and Abstracts Views on Vision4Press platform.
Data correspond to usage on the plateform after 2015. The current usage metrics is available 48-96 hours after online publication and is updated daily on week days.
Initial download of the metrics may take a while.