Fig. 1
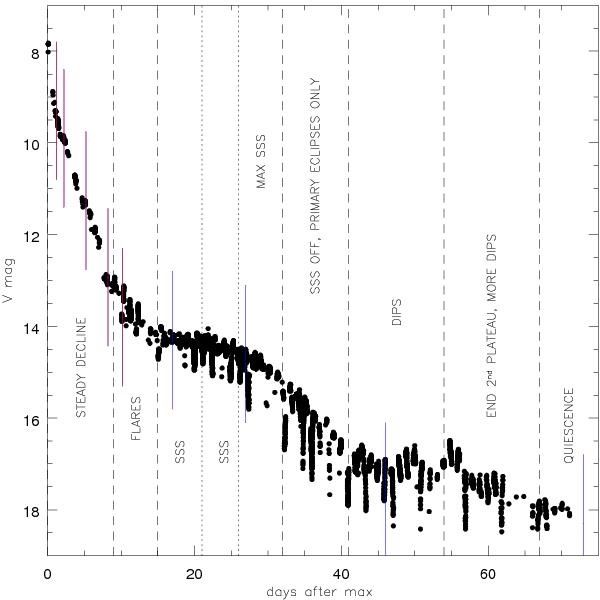
U ScoV-band light curve (courtesy of Brad Schaefer). The vertical black dashed lines marks the evolutionary phases identified by Schaefer et al. (2011), while the red and blue vertical segments marks the epoch of our FEROS and X-Shooter spectroscopic observations, respectively. Each of the light curve evolutionary phases has been marked in the figure itself. More details can be found in Schaefer et al. (2011).
Current usage metrics show cumulative count of Article Views (full-text article views including HTML views, PDF and ePub downloads, according to the available data) and Abstracts Views on Vision4Press platform.
Data correspond to usage on the plateform after 2015. The current usage metrics is available 48-96 hours after online publication and is updated daily on week days.
Initial download of the metrics may take a while.