Fig. 3
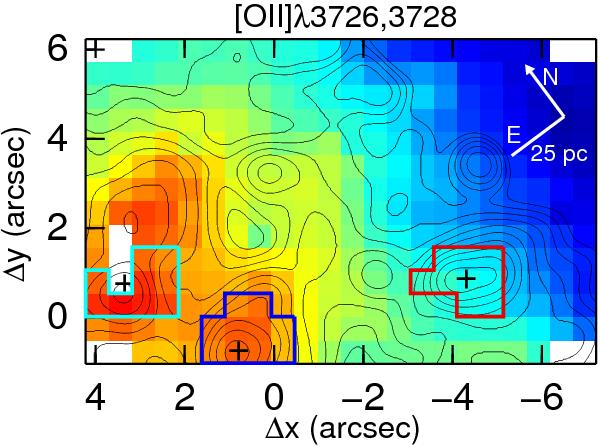
Ionized gas distribution as traced by the [O ii] emission line doublet. We have over-plotted contours corresponding to the HST-ACS images in the F435W filter (programme 10609, P.I.: Vacca) convolved with a Gaussian of 0 8 to simulate the seeing at Paranal. The position of the three main peaks of continuum emission are marked with crosses. The map is presented in logarithmic scale in order to emphasize the relevant morphological features and cover a range of 1.4 dex. Flux units are arbitrary. Utilized apertures to extract the selected spectra have been outlined according to the following color code: cyan – Knot ♯1; blue – Knot ♯2; red – Knot ♯3. Note the existence of three dead spaxels at
  as well as absence of signal in the spaxels at the four corners of the field of view. All of these spaxels will be marked hereafter by white rectangles. The scale and orientation are indicated.
Current usage metrics show cumulative count of Article Views (full-text article views including HTML views, PDF and ePub downloads, according to the available data) and Abstracts Views on Vision4Press platform.
Data correspond to usage on the plateform after 2015. The current usage metrics is available 48-96 hours after online publication and is updated daily on week days.
Initial download of the metrics may take a while.