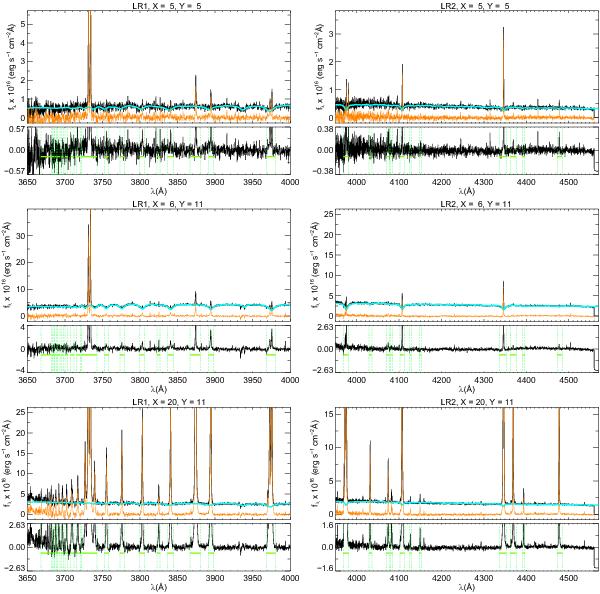
Fig. 2

Representative spectra to illustrate the modelling and subtraction of the underlying stellar population emission for the LR1 (left) and LR2 (right) data cubes. The selected spaxels show typical emission in the lowest surface brightness area (first row), the peak of continuum emission ♯3, associated to two relatively old clusters (second row), and the peak of emission in Hγ (third row). Each individual graphic contains the observed, modelled and subtracted spectrum in black, cyan and orange, respectively. Below this main graphic there is an auxiliary one showing a zoom of the subtracted spectrum in black together with the spectral regions that were masked from the continuum fitting (green).
Current usage metrics show cumulative count of Article Views (full-text article views including HTML views, PDF and ePub downloads, according to the available data) and Abstracts Views on Vision4Press platform.
Data correspond to usage on the plateform after 2015. The current usage metrics is available 48-96 hours after online publication and is updated daily on week days.
Initial download of the metrics may take a while.


