Fig. 14
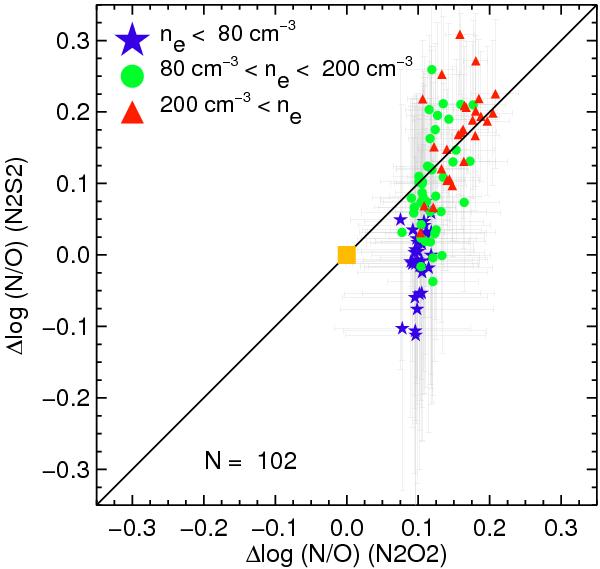
Comparison between the residuals for the determination of N/O based on the two strong line methods under consideration with respect to the direct one. The locus of equal residuals is indicated with a black line. An orange square marks the position where the three methods agree. Data were divided in three bins of ne as in Figs. 7 and 12.
Current usage metrics show cumulative count of Article Views (full-text article views including HTML views, PDF and ePub downloads, according to the available data) and Abstracts Views on Vision4Press platform.
Data correspond to usage on the plateform after 2015. The current usage metrics is available 48-96 hours after online publication and is updated daily on week days.
Initial download of the metrics may take a while.