Free Access
Fig. 12
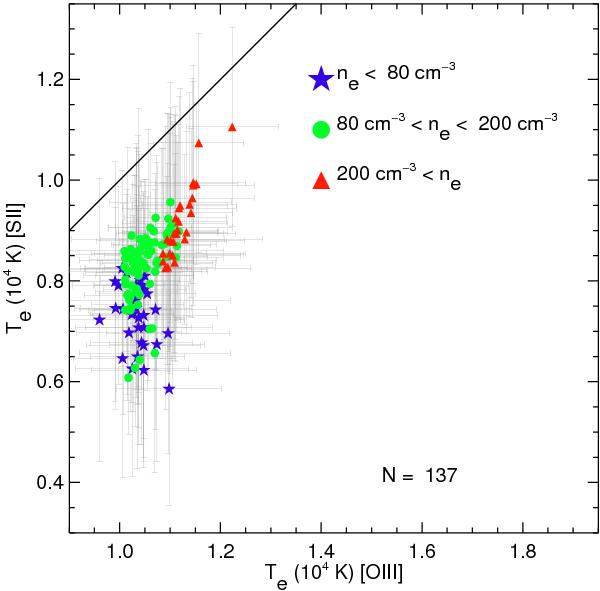
Comparison between the predicted Te([O iii]) and Te([S ii]). Spaxels were grouped in the same three bins in ne([O ii]) as in Fig. 7 as it is indicated in the upper right-hand corner of the diagram.
Current usage metrics show cumulative count of Article Views (full-text article views including HTML views, PDF and ePub downloads, according to the available data) and Abstracts Views on Vision4Press platform.
Data correspond to usage on the plateform after 2015. The current usage metrics is available 48-96 hours after online publication and is updated daily on week days.
Initial download of the metrics may take a while.