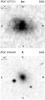
Fig. 7
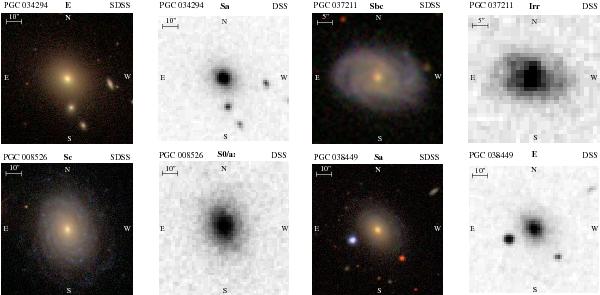
Examples of the SDSS DR8 and DSS I images of SN host galaxies representing the cases when |tour − tHyperLeda| ≥ 3. The PGC object identifier is listed at the top with our (left) and the HyperLeda (mainly selected from the RC3, right) classifications. In all images, north is up and east to the left.
Current usage metrics show cumulative count of Article Views (full-text article views including HTML views, PDF and ePub downloads, according to the available data) and Abstracts Views on Vision4Press platform.
Data correspond to usage on the plateform after 2015. The current usage metrics is available 48-96 hours after online publication and is updated daily on week days.
Initial download of the metrics may take a while.