Fig. 6
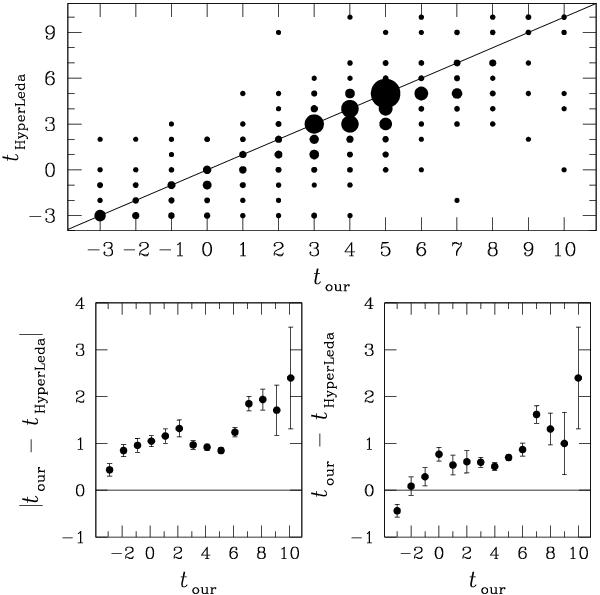
Top: comparison of HyperLeda (reordered) versus our t morphological types for 1313 host galaxies with available classifications. Point sizes are keyed to the number of objects. Bottom: the distributions of differences of our and HyperLeda t-types according to our classification. The error bars for the mean values in each bin are presented. The solid lines in each figure are added to visually better illustrate the deviation in classifications.
Current usage metrics show cumulative count of Article Views (full-text article views including HTML views, PDF and ePub downloads, according to the available data) and Abstracts Views on Vision4Press platform.
Data correspond to usage on the plateform after 2015. The current usage metrics is available 48-96 hours after online publication and is updated daily on week days.
Initial download of the metrics may take a while.