Fig. 4
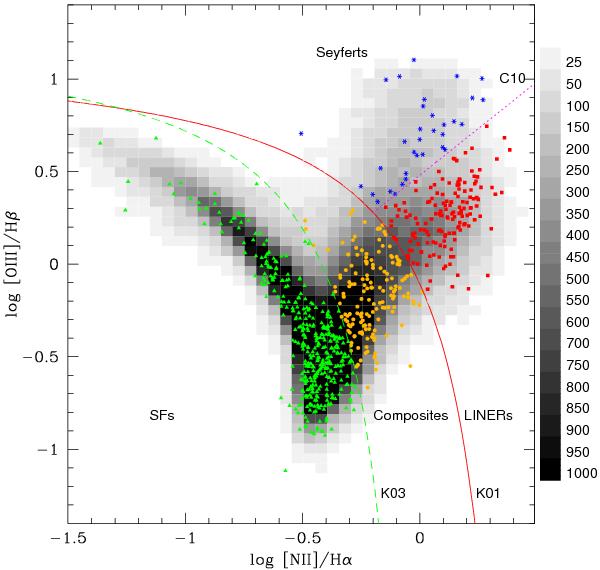
BPT spectral diagnostic diagram for 727 host galaxies with narrow emission-lines. Star forming (SF) and composite galaxies are displayed with green triangles and orange circles, respectively. The blue asterisks and red squares respectively are Seyferts and LINERs. The red solid line shows the theoretical demarcation line separating AGN from SF galaxies proposed by Kewley et al. (2001, K01), while the green dashed line is the empirical line proposed by Kauffmann et al. (2003, K03). The magenta dotted line is the Seyfert-LINER demarcation line proposed by Cid Fernandes et al. (2010, C10). The underlying density distribution of the SDSS emission-line galaxies is shown in grayscale. The grayscale bar in the right represents the number of galaxies in each density bin.
Current usage metrics show cumulative count of Article Views (full-text article views including HTML views, PDF and ePub downloads, according to the available data) and Abstracts Views on Vision4Press platform.
Data correspond to usage on the plateform after 2015. The current usage metrics is available 48-96 hours after online publication and is updated daily on week days.
Initial download of the metrics may take a while.