Fig. 13
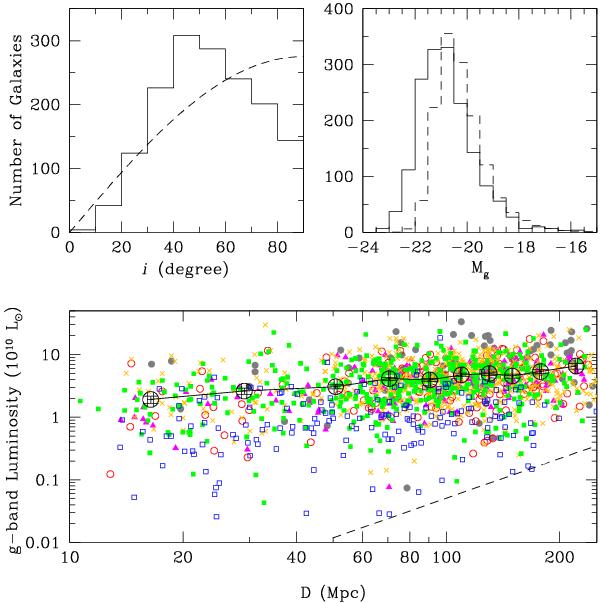
Top left: distribution of the inclination angles for disk (S0-Sm) galaxies. The dashed curve represents the expected random distribution. Top right: distribution of corrected g-band absolute magnitudes for the classified (E-Im) galaxies. The dashed histogram shows the distribution of g-band absolute magnitudes of the SDSS Main Galaxy sample (the values are divided by 500 for the sake of clarity). Bottom: the g-band luminosity of the same galaxies as a function of their distance. The color and symbol coding corresponds to Fig. 11. The average luminosity in different distance bins is overplotted as big open circles with error bars of the mean values. The dashed line represents the selection limit of the SDSS Main Galaxy spectroscopic sample (r ≤ 17.77) for the extinction corrected Petrosian magnitude, assuming g − r = 0.64.
Current usage metrics show cumulative count of Article Views (full-text article views including HTML views, PDF and ePub downloads, according to the available data) and Abstracts Views on Vision4Press platform.
Data correspond to usage on the plateform after 2015. The current usage metrics is available 48-96 hours after online publication and is updated daily on week days.
Initial download of the metrics may take a while.