Fig. 9
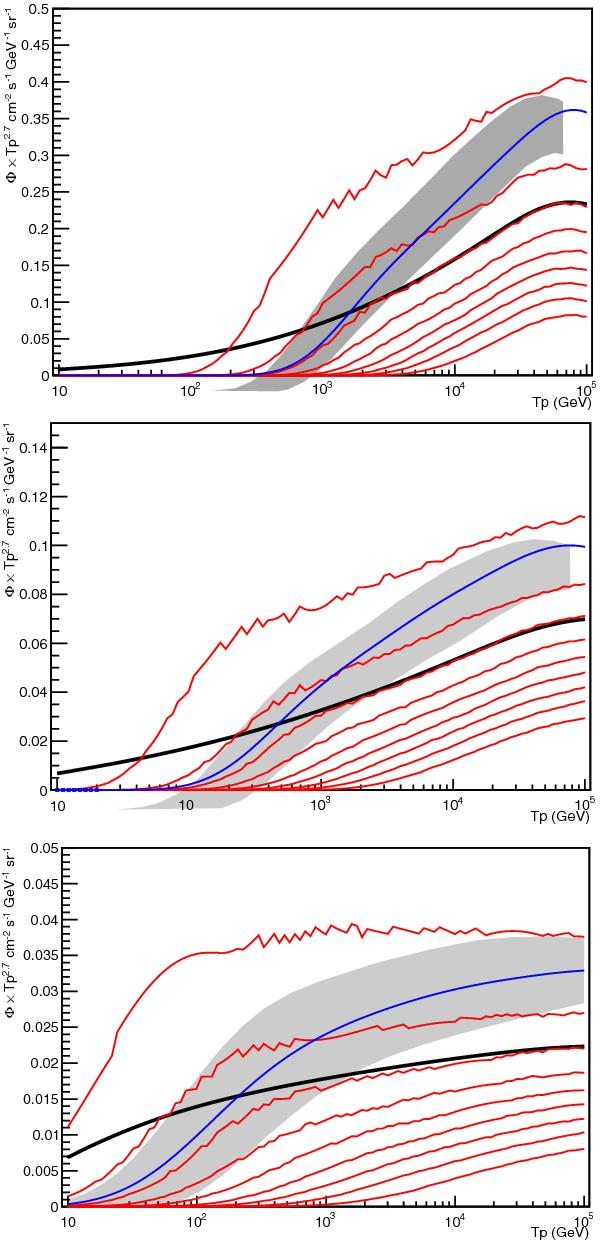
In each panel, the red lines correspond to the 10% quantiles of the CR proton flux generated by random sources drawn in the local region. The mean value is indicated by the black curve. The flux produced by the sources that belong to our catalogue is represented in blue. The systematic errors associated to the uncertainties on the distances and ages of these objects span the grey band (standard deviation). All curves are derived with a supernova explosion rate of ν = 3century-1. The min, med, and max propagation benchmark models are considered.
Current usage metrics show cumulative count of Article Views (full-text article views including HTML views, PDF and ePub downloads, according to the available data) and Abstracts Views on Vision4Press platform.
Data correspond to usage on the plateform after 2015. The current usage metrics is available 48-96 hours after online publication and is updated daily on week days.
Initial download of the metrics may take a while.