Fig. 7
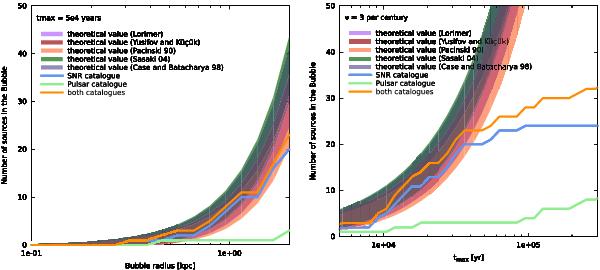
Bands indicate the theoretical expected number of sources within distance r and for a given age (left), or with ages younger than t within a given distance (right), for a supernova rate of three explosions per century in the Galaxy. The width of the bands gauges the uncertainty in the number of local sources due to the shot-noise effect. The curves feature the cumulated number of sources in our catalogue. This one appears to be complete for t < 5 × 10⁴y and r < 2kpc.
Current usage metrics show cumulative count of Article Views (full-text article views including HTML views, PDF and ePub downloads, according to the available data) and Abstracts Views on Vision4Press platform.
Data correspond to usage on the plateform after 2015. The current usage metrics is available 48-96 hours after online publication and is updated daily on week days.
Initial download of the metrics may take a while.