Fig. 2
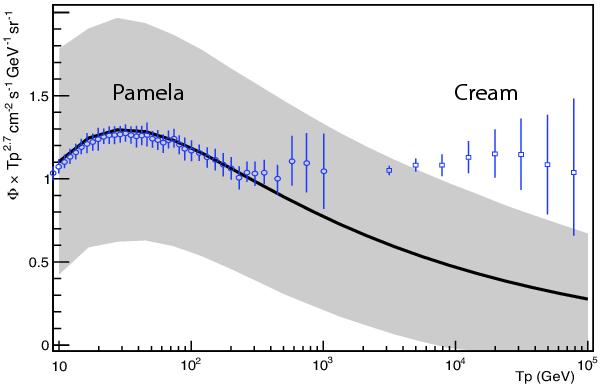
Proton flux obtained for the min diffusion model (see below) and a source frequency μ = 3century-1. The band displays the standard deviation σφ obtained analytically, with a lower cut-off on the ages of the sources tmin = 100years. The blue symbols indicate the flux measured by CREAM (Yoon et al. 2011) and PAMELA (Adriani et al. 2011).
Current usage metrics show cumulative count of Article Views (full-text article views including HTML views, PDF and ePub downloads, according to the available data) and Abstracts Views on Vision4Press platform.
Data correspond to usage on the plateform after 2015. The current usage metrics is available 48-96 hours after online publication and is updated daily on week days.
Initial download of the metrics may take a while.