Fig. 11
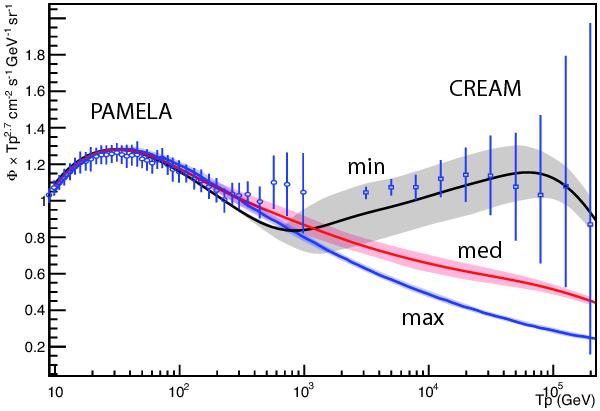
Blue, red, and black curves feature the total flux φ computed as the sum of the mean external flux ⟨ φext ⟩ and the contribution φcat from the catalogue. They correspond to the max, med and min CR propagation benchmark models, respectively. The bands that extend around the curves have the same meaning as in Fig. 9. They indicate the standard deviation of the flux associated to the observational errors on the ages and distances of the SNR of the catalogue.
Current usage metrics show cumulative count of Article Views (full-text article views including HTML views, PDF and ePub downloads, according to the available data) and Abstracts Views on Vision4Press platform.
Data correspond to usage on the plateform after 2015. The current usage metrics is available 48-96 hours after online publication and is updated daily on week days.
Initial download of the metrics may take a while.