Fig. 5
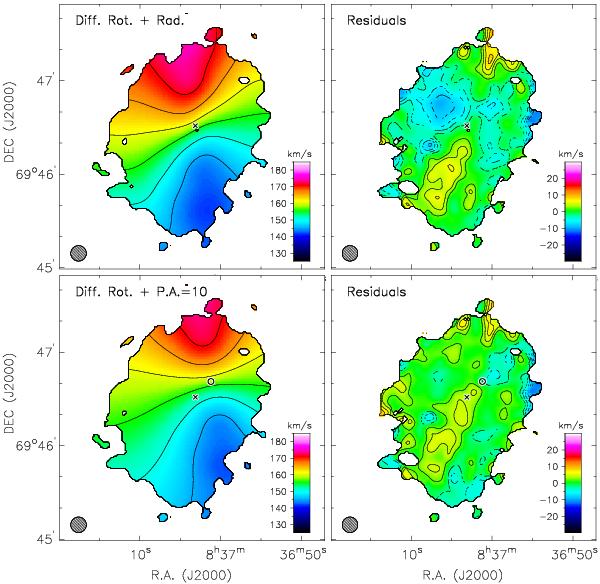
Left: velocity fields derived from disk-models with different geometrical parameters: optical center (cross), PA = 0°, and radial motions of ~5 km s-1 (top panel, same as Fig. 2middle-right); shifted dynamical center (circle), PA = 10°, and no radial motions (bottom panel). Contours are the same as in Fig. 2. Right: differences between the observed and the model velocity fields. Contours are at ±2, ±4, ±6, ±8 km s-1. The filled circle shows the beam.
Current usage metrics show cumulative count of Article Views (full-text article views including HTML views, PDF and ePub downloads, according to the available data) and Abstracts Views on Vision4Press platform.
Data correspond to usage on the plateform after 2015. The current usage metrics is available 48-96 hours after online publication and is updated daily on week days.
Initial download of the metrics may take a while.