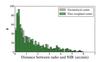
Fig. 4
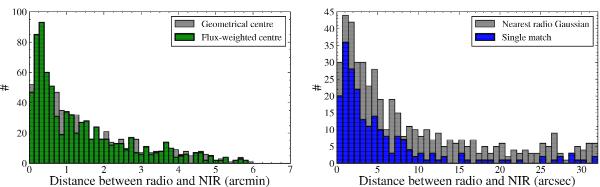
Histogram of angular distance between the NIR center of the galaxy (i.e., 2MRS coordinates) and different measure of the center for the radio emission for the candidate matches from the catalog cuts (Eq. (1)). Left: the geometrical center (Eq. (2)) and the flux-weighted center (Eq. (3)). Right: the minimum angular distance between the galaxy and any of the matched radio sources for galaxies with a single match (thick blue line) and multiple matches (thin grey line).
Current usage metrics show cumulative count of Article Views (full-text article views including HTML views, PDF and ePub downloads, according to the available data) and Abstracts Views on Vision4Press platform.
Data correspond to usage on the plateform after 2015. The current usage metrics is available 48-96 hours after online publication and is updated daily on week days.
Initial download of the metrics may take a while.