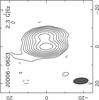
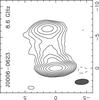
Fig. 4
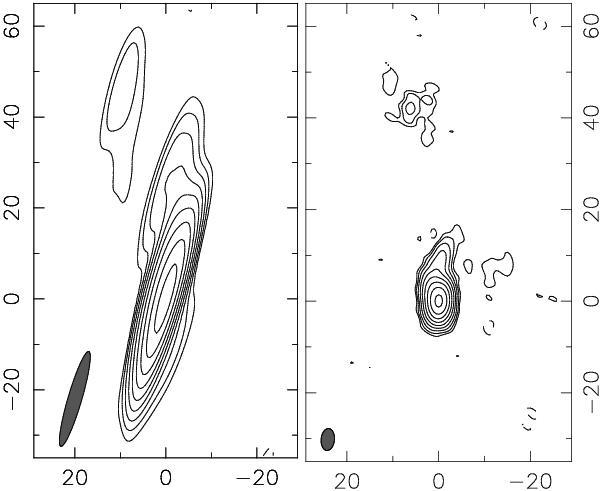
Naturally weighted CLEAN images at 2.3 GHz of the low-declination source J0403–3605 without (left) and with the data (right) from TIGO antenna. The contours are shown at the same levels, starting from 2 mJy beam-1 and increasing by a power of 2. The axes of each image are given in milliarcseconds. The shaded ellipse in the lower left corner of each image indicates the full width at half maximum (FWHM) of the restoring beam.
Current usage metrics show cumulative count of Article Views (full-text article views including HTML views, PDF and ePub downloads, according to the available data) and Abstracts Views on Vision4Press platform.
Data correspond to usage on the plateform after 2015. The current usage metrics is available 48-96 hours after online publication and is updated daily on week days.
Initial download of the metrics may take a while.